
The Monday Report That Writes Itself: Live Visibility for Leadership Teams
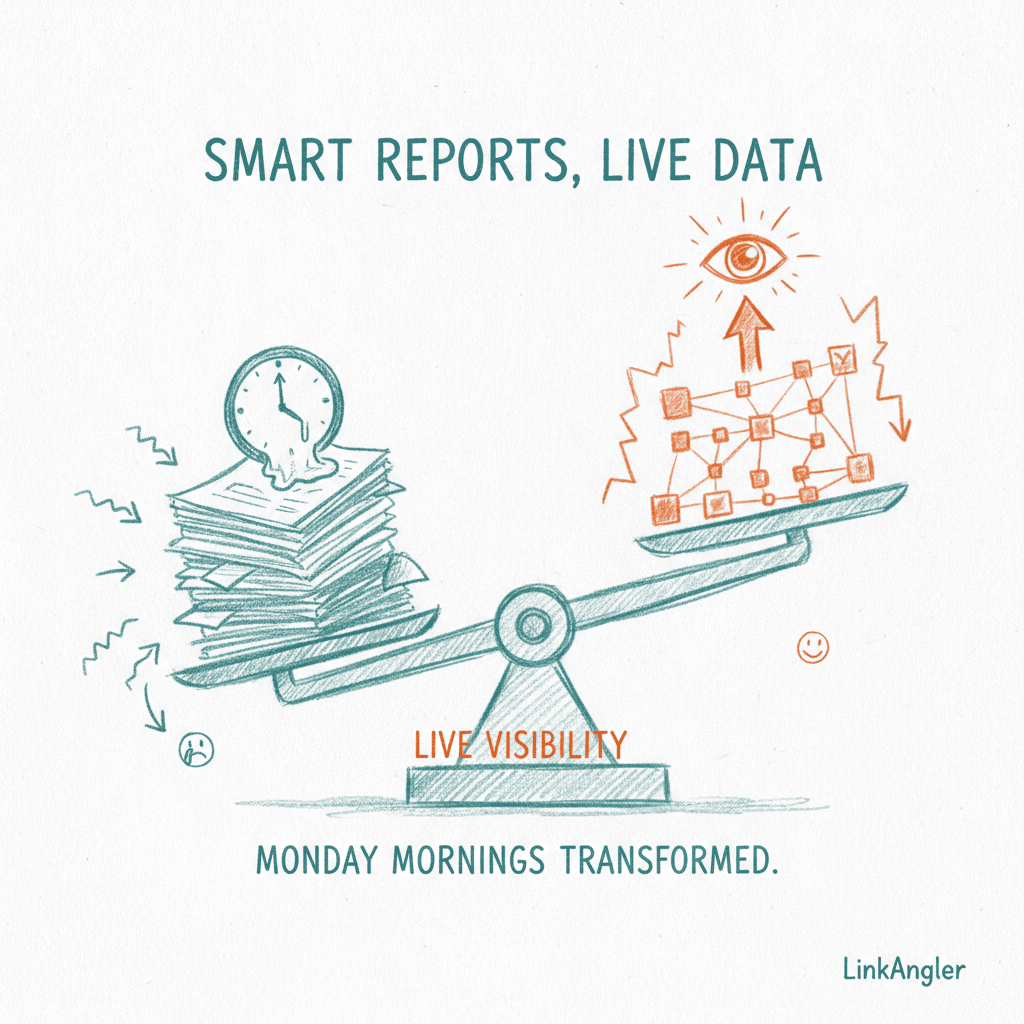
There is a quiet tax on most leadership teams. It is not listed on a balance sheet. It does not appear in your payroll software. This tax is paid every week in the hours spent compiling numbers from separate tools and spreadsheets into something presentable for the Monday meeting. The burden is double-edged. First, there are the direct hours themselves, a significant drain on valuable time. Second, and more insidious, is the lag. By the time the report is finally complete and lands on desks, it describes last week. It is a historical record, not a live view.
Decisions on Stale Data
I have seen this scenario play out countless times. A leadership team I once worked with was consistently making critical business calls based on numbers that were days, if not a week, out of date. Nobody within the organisation actively identified this as a problem. It was simply accepted as the reality of "how reporting works". This collective blind spot meant that pipeline reviews conducted on a Monday morning often reflected data from the previous Wednesday, at best. A critical delivery issue, for example, might only surface in a compiled report after the client had already experienced it, perhaps even escalated it. Strategy conversations, instead of looking forward, inevitably began with the framing, "well, as of last week...".
This lag creates a significant drag on responsiveness. Imagine trying to navigate a ship not by looking at the water ahead, but by reviewing a detailed map of where you were two days ago. You are always behind the curve. Opportunities are missed, problems escalate unnecessarily, and resources are allocated based on yesterday's priorities rather than today's reality. The very purpose of a leadership team, to guide the business proactively, is undermined by reactive data. The competitive advantage is not a slick dashboard alone. It is the compounding effect of every decision being made a few days earlier, on numbers that are actually true.
What Changed: From Lag to Live with Automated Business Reporting
The transformation for that leadership team, and for many others who face similar reporting challenges, came through a commitment to automated business reporting. We didn't just tweak their existing process. We rebuilt their reporting pipeline end-to-end. This meant establishing direct, automatic data pulls from the actual systems where work happens: CRM, project management, finance, marketing platforms, and more. This raw data was then assembled, not manually, but programmatically, into the specific views each audience required. These views were made available on demand, replacing static, weekly documents.
The immediate, tangible change was the disappearance of the weekly compile. This task, which had consumed significant hours across multiple departments, simply vanished. But the more profound shift was in the nature of the conversations themselves. Instead of reviewing what happened, the team began acting on what was happening. This meant faster pivots in response to market changes, sharper allocation of resources to critical areas, and the ability to produce board packs in seconds instead of hours of painstaking, manual assembly. The time saved was significant, but the increase in agility and precision was invaluable. They had turned a look-back mirror into a live-feed monitor.
The Pattern Behind It: Deconstructing the Reporting Burden
Almost every traditional reporting burden, when you break it down, decomposes into the same three steps. Understanding these steps is the first move towards true automation.
Step 1: Gather
This is the collection phase. It typically involves logging into five, ten, or even more disparate tools. Then it's a series of exports, often into CSV or Excel files. Finally, the tedious copy-pasting of selected data points into a master spreadsheet. Think about the variety of systems involved: your CRM for sales pipeline figures, your accounting software for revenue, a project management tool for task completion rates, a marketing platform for lead generation, and perhaps a customer support system for service metrics. Each has its own rhythm, its own export format, and its own logging requirements. This step is a prime candidate for automation. Any process that involves human hands performing repetitive copy-pasting is inefficient and prone to transcription errors, no matter how careful the person.
Step 2: Reshape
Once gathered, the raw data is rarely in a format suitable for direct consumption. This step involves reshaping it. This means applying the same pivot tables, the same filtering criteria, the same calculations, and the same formatting every single week. "Total new leads by source," "percentage completion of Q3 projects," "monthly recurring revenue," "churn rate." These are all specific calculations that need to be applied consistently. For organisations relying on manual methods, this means opening last week's report, saving it as a new version, deleting the old data, pasting in the new, and then hoping all the formulas still work. It is a high-stakes, low-reward process that consumes valuable analytical brainpower that could be better spent interpreting, not formatting. This reshaping step is precisely where templates, scripts, and pre-defined queries, automatically executed, can shine.
Step 3: Narrate
Finally, the numbers need context. The narration step involves writing the summary paragraph or bullet points that explain what the numbers mean. This often happens late on a Sunday night, under pressure, by the person tasked with compiling the report. It is subjective, prone to oversight, and can vary in quality depending on the compiler's energy levels or specific interpretations. Transparently, while some narrative elements fundamentally require human insight, even aspects of this step can benefit from automation. For instance, an automated system can highlight anomalies, flag significant changes from previous periods, or even draft initial observations based on pre-defined criteria. The output improves rather than degrades. There are no transcription errors from hurried copy-pasting, no forgotten data sources from a late-night rush, and no version confusion where two people have slightly different interpretations of the "latest" report.
All three of these steps are automatable today. Yes, even a significant portion of the narration, if designed correctly.
Practical Steps to Implementing Automated Business Reporting
For leadership and operations teams looking to move beyond the traditional Monday report, here are some practical steps to consider.
Start with the "Why" and "What"
Before diving into tools, define what truly matters.
- Identify Key Decisions: What are the most important recurring decisions your leadership team makes? What data underpins these decisions?
- Map Data Sources: For each key decision, identify exactly where the necessary data lives. Which systems, which departments?
- Define Audiences and Views: Who needs to see this data, and in what format? The CEO likely needs a high-level summary, while a department head might need granular detail.
Audit Your Current Process (The Hidden Costs)
How many hours a week does your organisation collectively spend assembling reports that could just as easily have been generated automatically? This might involve a small team, two full working days every week. Or it might be spread across five people, each spending a few hours. Use a simple tool like a time audit calculator to quantify these hours and translate them into a real monetary cost. You will likely be surprised.
More importantly, how old is the data behind your most important recurring decision? If the answer is anything more than a few hours, you have a problem. If that answer is uncomfortable, what would your leadership team do with that liberated time, and that newfound freshness of data? Faster market responses, proactive problem-solving, more strategic thinking, and less time buried in spreadsheets are all within reach.
Phased Implementation
Do not try to automate everything at once. Pick one critical report that consumes significant time and is built from easily accessible data.
- Pilot Project: Select a single report. For example, the weekly sales pipeline summary.
- Identify Integration Points: Can you directly connect to your CRM's API? Or does it offer automated exports to a cloud storage solution?
- Choose Your Automation Tools: This doesn't necessarily mean a massive BI platform from day one. Sometimes, scripting solutions, webhooks, or even simple Zapier or Make integrations can link systems together to flow data.
- Design the Output: How should the data be presented? An internal dashboard, a regularly updated spreadsheet in a shared drive, or an email digest? Focus on clarity and actionable insights.
Beyond the Numbers: The Strategic Impact
Automated business reporting is not just about efficiency. It creates a strategic advantage. When your data is live, your team can react to shifts in customer behaviour, market trends, or internal performance issues with unprecedented speed. This agility allows for smaller, more frequent course corrections, which are far less disruptive and costly than major overhauls initiated weeks after a problem has festered. It also fosters a data-driven culture, moving conversations from anecdotal observations to evidence-based discussions. This means less debate over "what happened" and more focus on "what to do next."
Addressing the "Human Touch"
Some argue that automation loses the human element. For certain tasks, I agree. I built LinkAngler out of an annoyance with tools that forced robotic interactions. I refuse to fully automate things like AI comments on other people's posts because they often do not sound human. A human review gate is crucial for ensuring quality and tone. But for the repetitive grinding of data compilation, humans are precisely the wrong tool for the job. Our strengths lie in interpretation, strategy, empathy, and creativity. Let machines handle the collection and basic shaping.
The line I hold is simple. Automate the gathering and the reshaping, because machines are better at both and never get tired at 11pm on a Sunday. Keep a human on the judgement, because deciding what a number means, and what to do about it, is the actual job.
Two Questions Worth Asking on Monday
The "Monday report that writes itself" is not a futuristic dream. It is an achievable reality for any leadership team willing to challenge the status quo of manual data compilation. The questions are straightforward: How many hours a week does your organisation spend assembling reports someone else could have generated? How old is the data behind your most important recurring decision? If the answer to either question is uncomfortable, it is time to reassess. Adopting automated business reporting shifts your focus from recreating history to shaping the future. It gives you hours back every week and equips you with the freshest, most accurate data, enabling faster pivots, sharper resource allocation, and ultimately, a more agile and competitive business.